Tamilnadu Samacheer Kalvi 4th Maths Solutions
Term 1
Chapter 6
Information Processing
Ex 6.3
Question1.
Write down the percentage of content in human body from the given pie–chart.
Answer
Protein 24%
Others 16%
Question 2.
The
number of varieties of ice creams in an ice cream parlour is given
below as a pie-chart. Answer the following questions.
1. How many varieties of Ice creams are
there ______.
Answer:
Three
2. Find the number of Vaniki Ice
creams ______.
Answer:
50
3. Find the total number of Chocolate
and Pista Ice
cream ______.
Answer:
50 (30 to 20)
4. Find the total number of Ice creams
______.
Answer:
100
Question 3.
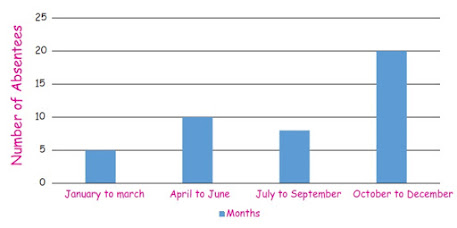
Absentees
record of a class of 30 children is given in a graph.
(i) In
which month there are more absentees?
Answer:
October to December since It will be winter season.
(ii) In which month there are less
absentees?
Answer:
January to March Since Annual Exam comes.
Question 4.
Draw a
pie-chart for the favourite sweets
of your family members.
Answer:
Question 5.
Collect
information about the favourite pets of
your classmates. Drow
bar-graph and pie-chart for the same data.
Answer:
தமிழ் கல்வி


No comments:
Post a Comment